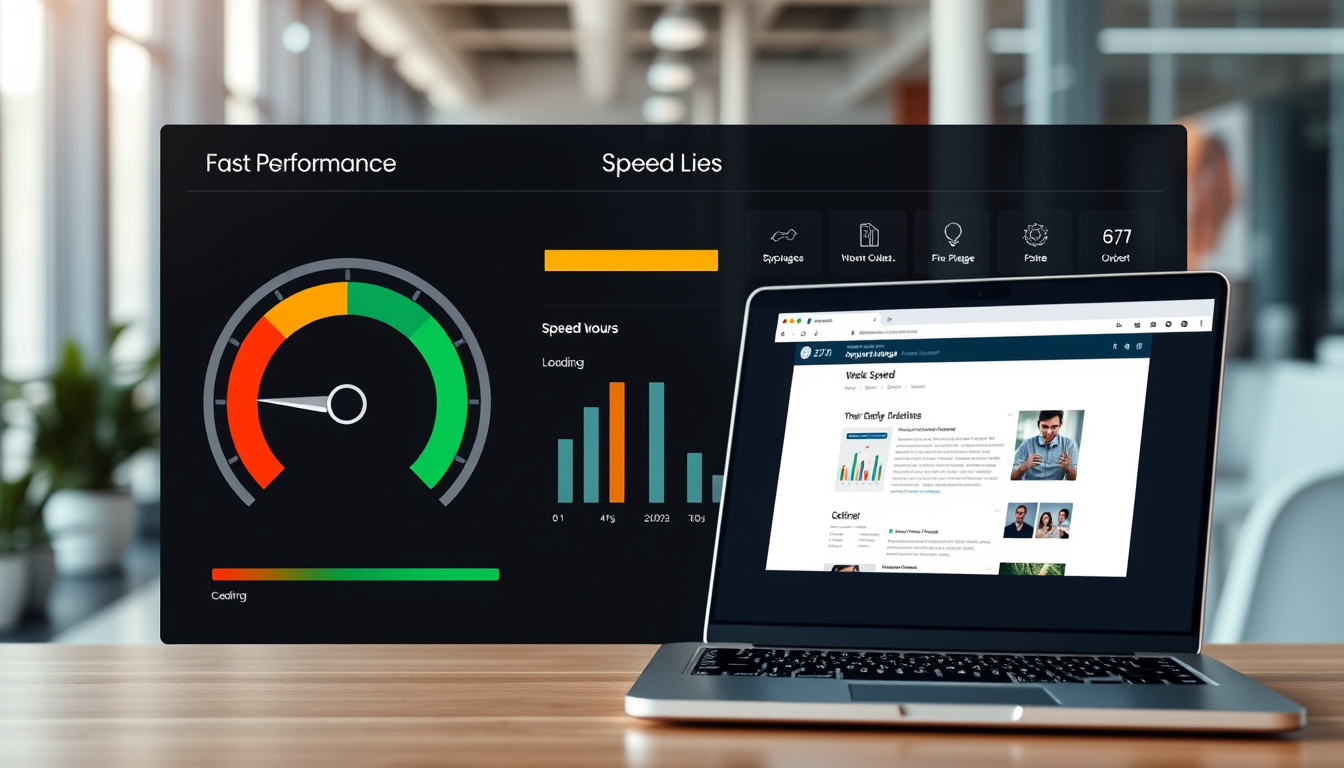

Few things frustrate a site owner more than watching visitors leave because a page just won’t load. Google PageSpeed Insights checker pinpoints exactly why your site lags — and what to do about it, combining simulated lab tests with real-world data from the Chrome User Experience Report.
Tool type: Free online tool by Google · Score range: 0–100 · Data sources: Lab data (simulated) and field data (Chrome UX Report) · Key metrics: LCP, FID, CLS (Core Web Vitals)
Quick snapshot
- PageSpeed Insights is free and run by Google (Google PageSpeed Insights)
- It uses Lighthouse under the hood (Chrome Developers)
- Field data comes from the Chrome User Experience Report (Chrome UX Report)
- The exact algorithm that weights metrics into the final performance score
- Whether the term “alaikas” refers to a specific third-party tool or a misspelling
- 2010 – Google Page Speed launched as a Chrome extension and online tool (Google Developers)
- 2018 – Rebranded to PageSpeed Insights with integration of Lighthouse (Google Developers)
- 2024 – Chrome extension deprecated; web version remains primary (Google Developers)
- Expect tighter integration with Google Search Console and more granular field data breakdowns (web.dev)
- Growing emphasis on Core Web Vitals as a ranking signal (Google Search Central)
Four facts that define the tool’s starting point:
| Attribute | Value |
|---|---|
| Launch year | 2010 (as Page Speed) |
| Current URL | pagespeed.web.dev |
| Core technology | Lighthouse + Chrome UX Report |
| Test types | Lab and Field data |
What is Google PageSpeed Insights?
Google PageSpeed Insights is a free tool provided by Google that analyzes the performance of a web page on both mobile and desktop devices. It delivers two kinds of data: lab data collected from a simulated environment using Lighthouse, and field data drawn from real users browsing in Chrome (Chrome UX Report). The tool scores pages from 0 to 100 and groups them into three categories: good (90+), needs improvement (50–89), and poor (under 50) (Google PageSpeed Insights documentation).
How does PageSpeed Insights work?
- You enter a URL and choose mobile or desktop analysis. The tool runs a Lighthouse audit in a headless Chrome browser, measuring metrics like load time, interactivity, and layout stability.
- If sufficient field data exists for that page, it also shows real-world metrics from the Chrome UX Report — aggregated across all Chrome users who visited that page (web.dev guide).
- The results appear in a dashboard with a performance score, a list of opportunities (specific fixes), and diagnostic information.
What metrics does PageSpeed Insights measure?
The tool focuses on six key metrics, with Core Web Vitals leading the way: Largest Contentful Paint (LCP), First Input Delay (FID), Cumulative Layout Shift (CLS), First Contentful Paint (FCP), Speed Index (SI), and Time to Interactive (TTI) (Chrome Developers). The overall performance score is a weighted composite of these metrics.
The implication: PageSpeed Insights provides Google’s own view of your site’s speed, making it essential for SEO auditing.
How to Use Google PageSpeed Insights Checker?
Running a test takes less than a minute. Here’s how to get the most out of it.
Step-by-step to run a test
- Open a browser and go to pagespeed.web.dev.
- Enter the full URL of the page you want to test (including
https://). - Click the “Analyze” button. The tool will run a Lighthouse audit and fetch field data if available.
- By default, results load for mobile. Toggle to desktop using the tab on the left.
- Review the performance score, then scroll down to “Opportunities” and “Diagnostics” for actionable fixes.
How to interpret the results dashboard
- Performance score: A weighted combination of all lab metrics. Green (90–100) indicates fast, orange (50–89) needs work, red (0–49) is slow (web.dev performance scoring guide).
- Field data: Shown only when enough real-user data exists. Includes LCP, FID, CLS, and FCP — each rated as good, needs improvement, or poor.
- Opportunities: Specific suggestions like “Serve images in next-gen formats” with estimated time savings.
- Diagnostics: Additional info about page structure, JavaScript execution, and resource size.
For site owners testing a single page: the workflow is identical for mobile and desktop. The real value lies in comparing lab and field data — if they diverge, your real users may be experiencing something the simulation misses.
The pattern: comparing lab and field data reveals whether your optimization efforts translate to real user improvements.
How to Improve Your PageSpeed Insights Score?
Once you have a baseline, the “Opportunities” section lists specific ways to boost your score. Below are the most common fixes, backed by Google’s own recommendations.
Common fixes for low scores
- Optimize Largest Contentful Paint (LCP): LCP is often dominated by the hero image or a large text block. Compress images, use next-gen formats (WebP, AVIF), and enable server-side caching to reduce server response time (web.dev: Optimize LCP).
- Reduce render-blocking resources: JavaScript and CSS that block rendering delay First Contentful Paint. Defer non-critical JS and inline critical CSS (web.dev).
- Fix Cumulative Layout Shift (CLS): Set explicit width and height attributes on images and embeds. Reserve space for ads and dynamic content (web.dev: Optimize CLS).
Optimizing images and JavaScript
- Images: compress with tools like Squoosh or use a CDN that auto-optimizes. Lazy-load below-the-fold images.
- JavaScript: minify and split bundles. Use the “Remove unused JavaScript” diagnostic to identify heavy libraries.
- Fonts: serve fonts from a CDN and use
font-display: swapto avoid invisible text (web.dev font guidelines).
A high lab score doesn’t guarantee a smooth user experience on slower connections. Field data — especially 75th percentile values — gives the truer picture. Focus on improving the field metrics, not just the simulated score.
The catch: a high lab score can mask issues on slower connections, so field data is the ultimate benchmark.
Google PageSpeed Insights vs Other Speed Checkers
When comparing speed tools, the differences boil down to methodology and data sources. Here’s how PageSpeed Insights stacks up against the three most common alternatives.
| Feature | PageSpeed Insights | GTmetrix | Pingdom | Lighthouse |
|---|---|---|---|---|
| Provider | GTmetrix (independent) | SolarWinds | ||
| Lab test engine | Lighthouse (headless) | Lighthouse (real browser) | Proprietary | Lighthouse (headless) |
| Field data | Chrome UX Report | None (lab only) | None (lab only) | None (lab only) |
| Scoring | 0–100 (lab + field) | Letter grades + performance score | Grade + performance score | 0–100 (lab) |
| Waterfall chart | No | Yes | Yes | In DevTools |
| Test locations | Simulated (US) | Multiple global locations | Multiple global locations | Local or simulated |
| Best for | Spot checks, field data analysis | Detailed timing, debugging | Uptime monitoring, global tests | Developer-level audits |
Each tool uses a different test environment: PSI simulates mobile hardware, while GTmetrix uses a real browser.
PageSpeed Insights vs GTmetrix
Both tools are powered by Lighthouse, but they can produce different scores because GTmetrix uses a real browser to load the page while PageSpeed Insights uses a headless/emulated browser (GTmetrix Blog (testing methodology)). GTmetrix also adds a “Structure” score that penalizes things like missing caching headers, which PageSpeed Insights doesn’t emphasize (InMotion Hosting (scoring differences)).
PageSpeed Insights vs Pingdom
Pingdom offers uptime monitoring and global test locations, but it doesn’t provide field data. Its lab tests run from multiple geographic regions, making it useful for checking latency from different continents. However, the underlying test engine is proprietary and less transparent than Lighthouse (Pingdom features page).
PageSpeed Insights vs Lighthouse
Lighthouse is the engine behind PageSpeed Insights. Running Lighthouse directly (via Chrome DevTools or CLI) gives you the same lab scores but without the field data layer. PageSpeed Insights wraps Lighthouse with the Chrome UX Report, so it’s better for understanding how real users experience the page (Chrome Developers).
For daily checks and field data analysis, PageSpeed Insights wins. For deep front-end debugging or monitoring from multiple locations, GTmetrix or Pingdom fills the gap. The savvy workflow: use PSI for the big picture, then drill into GTmetrix’s waterfall for the details.
What Are Core Web Vitals in PageSpeed Insights?
Core Web Vitals are a subset of metrics that Google considers essential for a good page experience. PageSpeed Insights reports them in the field data section and highlights whether each passes or fails.
Definitions of LCP, FID, and CLS
- LCP (Largest Contentful Paint): Measures loading performance — the time it takes for the largest visible element to render. Good: ≤ 2.5 seconds (web.dev: LCP).
- FID (First Input Delay): Measures interactivity — the time from when a user first interacts with the page to when the browser responds. Good: ≤ 100 ms (web.dev: FID).
- CLS (Cumulative Layout Shift): Measures visual stability — the sum of unexpected layout shifts. Good: ≤ 0.1 (web.dev: CLS).
How Core Web Vitals affect SEO
Since May 2021, Core Web Vitals have been part of Google’s page experience ranking signals (Google Search Central blog). Passing all three thresholds doesn’t guarantee a top ranking, but failing them puts a page at a disadvantage — especially for mobile search. PageSpeed Insights is the easiest way to check your site’s current Vitals status.
The implication: improving Core Web Vitals directly impacts search visibility.
What’s unclear
- PageSpeed Insights is free and run by Google (Google PageSpeed Insights).
- It uses Lighthouse under the hood (Chrome Developers).
- Field data comes from the Chrome User Experience Report (Chrome UX Report).
- The tool provides separate mobile and desktop scores on a 0-100 scale (Google PageSpeed Insights).
Confirmed facts
- The exact algorithm that combines weighted metrics into the performance score.
- Whether the term “alaikas” indicates a specific branded checker or is simply a misspelling of “analysis.”
“Make your web pages fast on all devices.”
— Google PageSpeed Insights documentation (Google)
“PageSpeed Insights is a free tool provided by Google to measure the speed of your website. It is used for spot checks and for comparing lab and field performance data.”
— Debugbear guide (GTmetrix Blog)
For anyone serious about website speed, the choice between tools matters less than the habit of testing regularly. PageSpeed Insights gives you the authority of Google’s own data. The lab scores flag what can be fixed; the field scores show what real users actually experience. The pattern is clear: use PSI as your daily health checker, then dig deeper with GTmetrix’s waterfall when you need to diagnose an issue.
For the average site owner, the implication is straightforward: you can improve your PageSpeed Insights score by following the Opportunities section — compress images, defer JavaScript, set dimensions for media. But remember that a perfect lab score on a simulator may still leave mobile users waiting. The real benchmark is field data: if your LCP passes both lab and field thresholds, you’re on solid ground. If not, keep optimizing.
pagespeedmatters.com, inmotionhosting.com, discourse.divhunt.com, wp-rocket.me
For a broader look at how site speed tools compare, you might also explore the Page Speed Checker by Alaikas to see how it weighs performance metrics differently.
Frequently Asked Questions
What is a good PageSpeed Insights score?
A score of 90 or above is considered “good,” 50 to 89 “needs improvement,” and below 50 “poor.” These thresholds apply to both mobile and desktop results (web.dev performance scoring guide).
Can PageSpeed Insights test staging or local URLs?
No — the tool requires a publicly accessible URL. For local or staging environments, run Lighthouse directly via Chrome DevTools or the CLI.
How often should I run PageSpeed Insights tests?
After any major site change (theme update, new plugins, image optimization). Monthly checks are a good baseline for ongoing monitoring.
Does PageSpeed Insights affect SEO?
Indirectly — the Core Web Vitals it measures are a ranking signal. A poor PSI score can coincide with lower rankings, but it’s not a direct penalty (Google Search Central).
Why does my PageSpeed Insights score differ from other tools?
Because each tool uses a different test environment (headless vs. real browser), different network throttling, and different scoring formulas. GTmetrix may show a higher score because it doesn’t simulate slow mobile hardware as aggressively (GTmetrix Blog).
How to fix “Avoid enormous network payloads” in PageSpeed Insights?
Reduce the total page size by compressing images, removing unused CSS/JS, and enabling compression (Gzip or Brotli). Aim for under 5 MB total transfer size (web.dev total byte weight).
Is there a PageSpeed Insights API?
Yes — the PageSpeed Insights API (v5) allows you to run tests programmatically. It returns JSON with lab and field data. Useful for dashboards and automated monitoring (Google API docs).

Jack Hayes is Senior Reporter at Oz Monitorly, covering breaking stories and explainers.